Course Highlights
Have a look at our engaging Power BI and Tableau course in Vadodara and learn what it has to offer.
In today’s rapidly evolving business landscape, data is the new currency. Organisations across all industries are leveraging vast amounts of information to drive strategic decisions, optimise operations, and gain a competitive edge. This shift has created an unprecedented demand for skilled professionals who can not only analyse complex datasets but also communicate their findings effectively through compelling visualisations.
At Webbrains Tech, our comprehensive Power BI and Tableau course in Vadodara is meticulously designed to transform you into one of these in-demand experts. This programme goes beyond theoretical concepts, providing you with a hands-on, project-based learning experience that will equip you with the practical skills needed to thrive in the world of business intelligence and data analytics.
We understand that choosing the right course can be a daunting task. You might be asking yourself, “what is Power BI?” or “How does it compare to Tableau?” Our course answers these questions and many more, providing a clear path from beginner to proficient data analyst. By the end of this program, you will not only have a deep understanding of these powerful tools but also a portfolio of projects that demonstrates your capability to future employers.
Why You Should Take This Power BI and Tableau Course in Vadodara
Choosing the right course is a crucial step towards your career goals. Our programme stands out by offering a holistic learning experience centred on practical application and career success.
Hands-on, Project-Based Learning: We believe in learning by doing. The course is built around real-world projects, enabling you to build a robust portfolio that demonstrates your skills to potential employers. You’ll move beyond theory to tackle real-world challenges.
Expert Instructors: Learn from seasoned professionals with extensive industry experience. Our trainers bring real-world insights and mentorship to the classroom, ensuring you get the most relevant and up-to-date knowledge.
Dual-Tool Expertise:Gain a significant competitive advantage by mastering both Microsoft Power BI and Tableau. Our curriculum addresses the nuances of Tableau vs Power BI, making you versatile and hireable in a wide range of companies.
100% Placement Assistance: Our commitment to your success doesn’t end with a certificate. We offer dedicated career counselling, resume building, and interview preparation to ensure you land your dream job. Our strong network of hiring partners in Vadodara and beyond gives you a direct pipeline to top opportunities.
Who Can Take This Course?
Our course is designed for a diverse audience, and no prior technical knowledge is required.
Fresh Graduates: Start your career with a highly sought-after skill set. A certificate in Power BI and Tableau will make your resume stand out.
Working Professionals:Enhance your current role or transition into a new one. This course is ideal for professionals in marketing, finance, sales, and IT looking to leverage data for better decision-making.
Career Changers: Looking for a career with a promising future? Data analytics offers high growth and excellent salary potential, and our programme is the perfect entry point.
Anyone Interested in Data:Whether you’re an entrepreneur or a student, if you’re curious about what Power BI is and how to visualise data, this course is for you.
Career Opportunities After Power BI and Tableau
Mastering these powerful tools opens the door to a wide array of high-demand and high-paying careers. The demand for professionals who can analyse and interpret data is at an all-time high, and our course prepares you for a variety of roles:
Data Analyst:
The most common role for our graduates. As a data analyst, you will collect, process, and perform statistical analysis on data to identify key trends and insights.
Business Intelligence (BI) Analyst:
Specialising in creating and maintaining dashboards and reports, you’ll help organisations monitor performance and make data-driven decisions.
Data Visualisation Specialist:
Focus on creating compelling and easy-to-understand visualisations using tools like Tableau and Power BI to tell a story with data.
Financial Analyst:
Leverage your skills to analyse financial data, track key performance indicators, and forecast future performance.
Get the Best Power BI and Tableau Course in Vadodara that Fits Your Requirement
We offer the course in various stages based on your requirements. From beginner to advanced, we offer the following course modules.
Foundation Courses: Designed for beginners, it includes the basic concepts of Power BI and Tableau.
Advanced Courses: These modules contain a deeper understanding of concepts to enhance your knowledge and skills.
Workshops: Short-term workshops are organized to gain practical learning experience in a limited duration.
Certification Courses: You can learn specialized skills with valid certification to authenticate your knowledge.
Online Webinars: Learn online from anywhere with our interactive webinars.
Customized Training: Customized to your learning requirements, we offer specialized training.
Some Key Features of Our Course
Our curriculum is meticulously designed to provide you with a comprehensive and effective learning experience.
In-depth Curriculum: Our Microsoft Power BI course covers everything from data modelling and transformation with DAX and Power Query to creating advanced reports.
The curriculum for Tableau is equally comprehensive, teaching you how to build compelling visualisations and dashboards.
Live Projects:Work on multiple projects based on real-world datasets to build a strong portfolio and gain practical experience.
Industry-Relevant Content:The course content is regularly updated to reflect the latest industry trends and features of both Power BI and Tableau.
Dedicated Support: Our team is always available to provide support, answer questions, and help you with any challenges you may face during your training.
Take the First Step Towards Your Data Science Journey. Enroll Today!
In a world where data is a strategic asset, mastering the tools to analyse and visualise it is a non-negotiable skill. Our Power BI and Tableau course in Vadodara is your ticket to a rewarding and future-proof career. With our expert trainers, hands-on approach, and dedicated placement assistance, you’ll be well-equipped to enter the job market with confidence. Whether you’re just starting with Power BI for beginners or looking to expand your existing skill set, our programme offers the perfect blend of theory and practice. Join us and start shaping your future as a data professional.

Get 100% job Assistance by Enrolling in Certified Data Science Training Course

Key Highlights

Limited Students Batch

One-on-One Attention

Experienced Instructors

Flexible Batches

Interactive Sessions

Live Industry Projects

Career Assistance

Skill-based Training
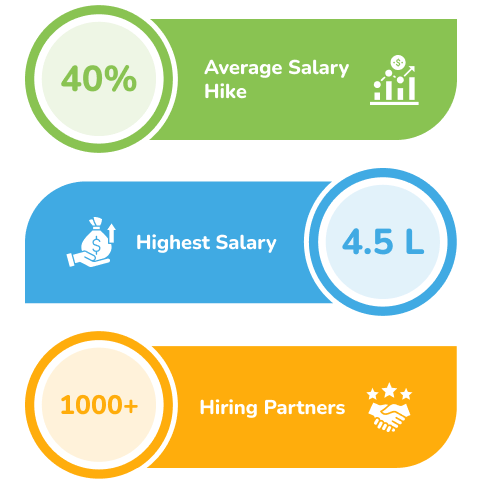
Students Placed and Hired in Companies
Providing training is not just what we offer, we believe that it is important to guide the individuals with post-training process as well by offering them placement assistance.



Course Curriculum
Introduction to BI, Power BI & Tableau
- What is Business Intelligence & why does it matter?
- Overview of Microsoft Power BI & Tableau
- Tableau vs Power BI – strengths & differences
- Setting up Power BI Desktop & Tableau Desktop
- Connecting to multiple data sources (Excel, SQL, Cloud, Web)
Data Preparation & Transformation
- Data cleaning & shaping with Power Query (Power BI)
- Data joins, unions & blending (Tableau)
- Handling null values, duplicates & formatting issues
- Building relationships & hierarchies
- Creating calculated fields, measures & parameters
Visualizations & Dashboards
- Basic charts: bar, line, pie, scatter plots
- Advanced visuals: Maps, TreeMaps, waterfalls, Heatmaps, Bubble charts, KPI cards
- Drill-down, drill-through & interactive filtering
- Creating dashboards in Power BI & Tableau
- Creating dashboards in Power BI & Tableau
Advanced Analytics & DAX / LOD Expressions
- Introduction to DAX (Data Analysis Expressions) in Power BI
- Measures vs Calculated Columns
- Time Intelligence & advanced business metrics
- Tableau’s LOD (Level of Detail) calculations
- Forecasting, trend analysis & predictive insights
Collaboration, Publishing & Integration
- Publishing reports on Power BI Service & Tableau Public/Server
- Sharing dashboards with teams & clients
- Row-Level Security (RLS) & user permissions
- Power BI integration with Excel, SQL & cloud platforms
- Tableau integration with R & Python
Real-World Projects & Capstone
- Industry-based projects: Finance, HR, Sales, Marketing, Healthcare
- Hands-on case studies for decision-making
- End-to-end BI project combining Power BI & Tableau
- Portfolio-ready dashboard creation & final project presentation
Complete the form below to Request Free Demo

Course Key Features
-
Introduction to BI & Visualisation Tools
-
Hands-on Projects with Microsoft Power BI & Tableau
-
Real-time Dashboards & Reports
-
Industry-focused Curriculum

Skills Covered
-
Microsoft Power BI
-
Tableau Desktop & Server
-
Data Modelling & DAX Functions
-
Advanced Excel & SQL
-
Interactive Dashboards & Visual Analytics

Job Roles
-
BI Developer
-
Data Visualisation Specialist
-
Power BI Analyst
-
Tableau Developer
-
Business Intelligence Consultant
STUDENT PLACEMENT
Being one of the finest IT training institute in Vadodara, we are keen on offering placements to our students with industry’s finest.
any questions? look here
Q. What is Power BI & how is it different from other BI tools?
- Power BI is Microsoft’s powerful data visualisation and business intelligence platform. It connects to many data sources, lets you clean and transform data, build dashboards and reports, and share insights across teams. Unlike many tools, it’s deeply integrated with Microsoft’s ecosystem.
Q. Can beginners join this course even if they don’t know BI tools?
- Yes. The course is designed for beginners — you’ll start with fundamentals of Power BI and Tableau, data concepts, and gradually move to advanced features. No prior BI or advanced coding experience is required.
Q. What exactly will I learn in this Microsoft Power BI course?
- You’ll learn connecting to data sources, using Power Query for cleansing, building data models, using DAX formulas, creating interactive dashboards, and publishing reports, plus Tableau basics with drag-and-drop visualisation, advanced dashboards, and comparative analysis in Tableau vs Power BI.
Q. Do you provide placement assistance?
- Absolutely. You will receive support with resume preparation, interview practice, and connecting with hiring partners. Our goal is to help you get a BI role after the course.

